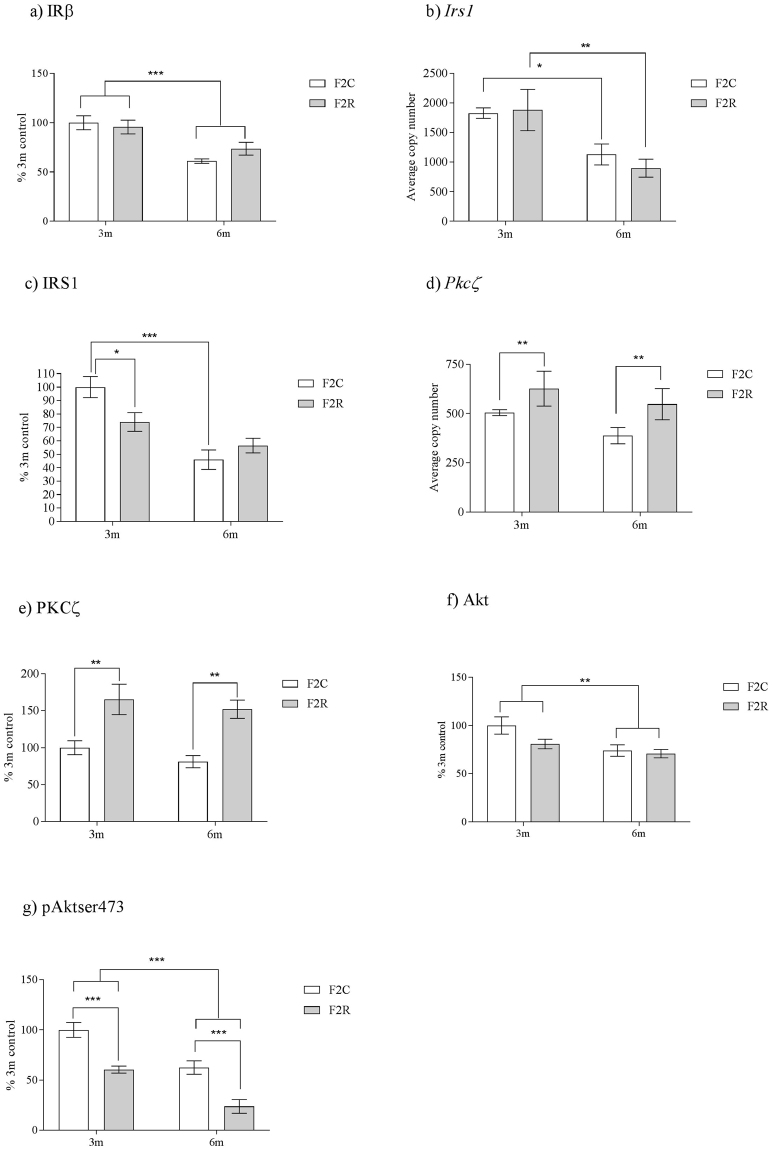
Figure 2.
The effect of in-utero protein restriction, accelerated postnatal growth and ageing upon expression of insulin signaling molecules in para-ovarian fat of 3 and 6 month female rats (a) IRβ protein expression (b) pIRβY1361 protein expression, (c) Irs1 mRNA expression (d) IRS1 protein expression (e) Pkc-ζ mRNA expression, (f) PKC-ζ protein expression, (g) Total Akt protein expression and (h) pAktser473 protein expression. Results are expressed as mean ± S.E.M. F2C = control; R = recuperated. *p < 0.05, **p < 0.01 and ***p < 0.001. N values: mRNA analysis = 7 per group. Protein analysis: 3 m C = 7, 3 m recuperated = 7, 6 m control = 6, 6 m recuperated = 5.

