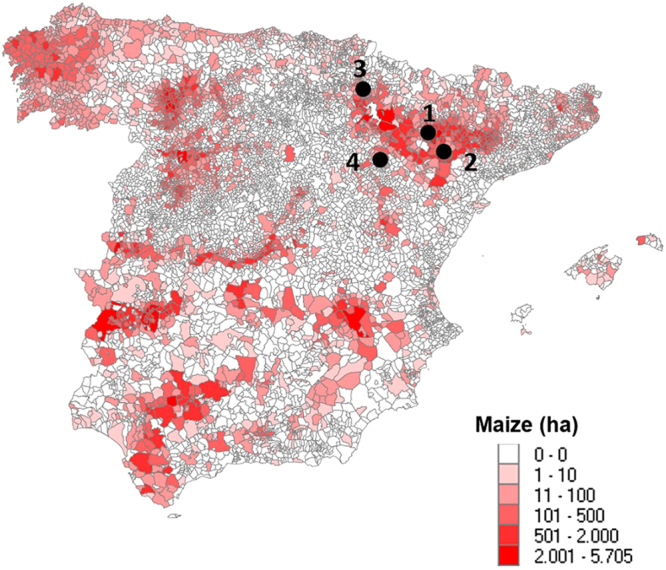
Figure 3.

Cultivated surface (ha) of maize in municipalities of Spain. Sampling locations in the Ebro Valley are indicated by dots: Los Monegros (1), Bajo Cinca (2), Tafalla (3) and Valdejalón (4). The map has been generated by own compilation with data corresponding to the Agrarian Census 2009 (http://www.ine.es/dyngs/INEbase/en/operacion.htm?c=Estadistica_C&cid=1254736176851&menu=resultados&secc=1254736194950&idp=1254735727106), taken from the Instituto Nacional de Estadística (INE) website: www.ine.es. To generate the map the following free specific software was needed: PC-Axis 2008, PX-Map 2001, and Municipal Maps (outlines of municipalities valid at 1 January 2009). All this software is available on the INE website (http://www.ine.es/ss/Satellite?c=Page&p=1254735116596&pagename=ProductosYServicios%2FPYSLayout&cid=1254735116596&L=1).
