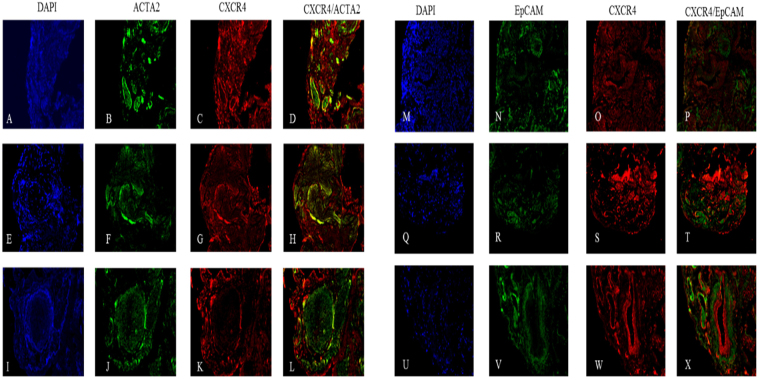
Figure 7.
Histological localization of CXCR4 to ACTA2+ cells and EpCAM+ cells in IPF. Representative images of three IPF tissue sections are stained for the presence of CXCR4 (C,G,K,O,S,W). Fibrotic foci stain positive for ACTA2 throughout but only show co-localization (denoted in yellow) with CXCR4 near the peripheral edges (L). Areas of dense fibrosis stain show co-localization of CXCR4 and ACTA2 (D,H) and the minimal presence of non-CXCR4 co-localized EpCAM (N,V,R).

