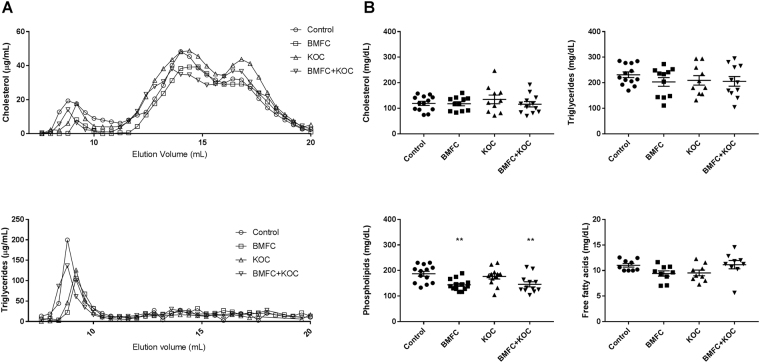
Figure 2.
Lipid levels and lipoprotein profile of rat plasma. (A) FPLC profile of plasma cholesterol and triglycerides. (B) Cholesterol, triglycerides, non-esterified fatty acids, and phospholipid levels in plasma. Values are means ± SEM. Statistically significant difference from control at *p < 0.05–0.005; **p < 0.005–0.0005. BMFC: buttermilk fat concentrate rich in phospho- and sphingolipids; KOC: krill oil concentrate rich in omega-3 fatty acids (eicosapentaenoic acid and docosahexaenoic acid) and phospholipids; BMFC + KOC: combination of BMFC and KOC.

