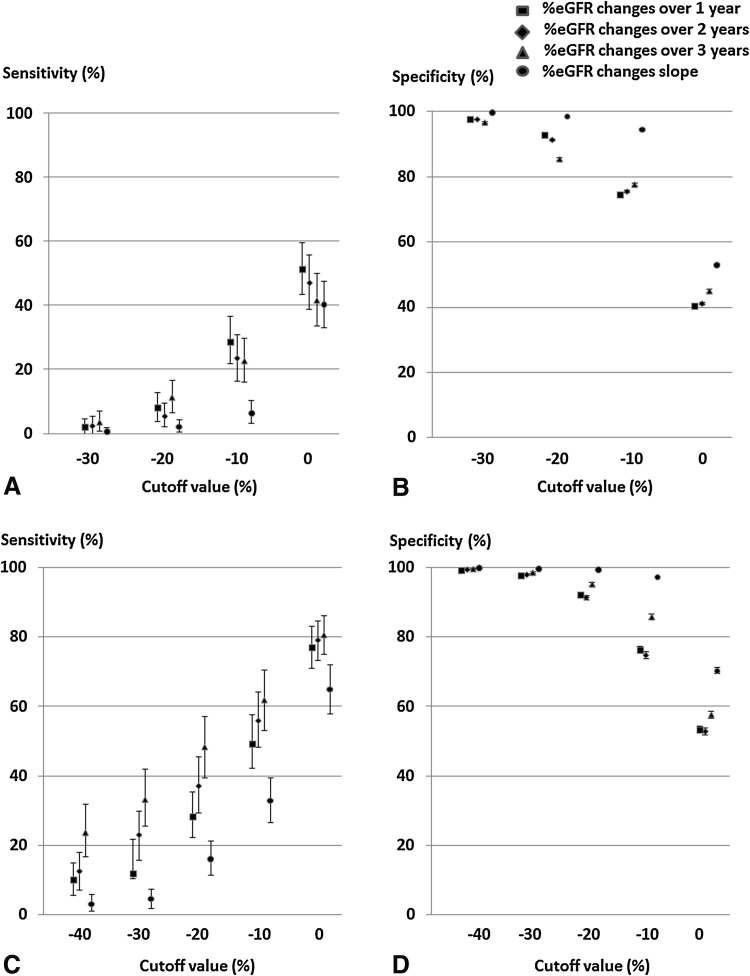
Fig. 4.
Sensitivities and specificities of ESRD based on a cutoff value of %eGFR change. a Sensitivities in the high-eGFR group, b specificities in the high-eGFR group, c sensitivities in the low-eGFR group, d specificities in the low-eGFR group. Sensitivities and specificities are shown with median and 95% confidence intervals. ESRD end-stage renal disease, cutoff values cutoff values of %eGFR change to predict ESRD

