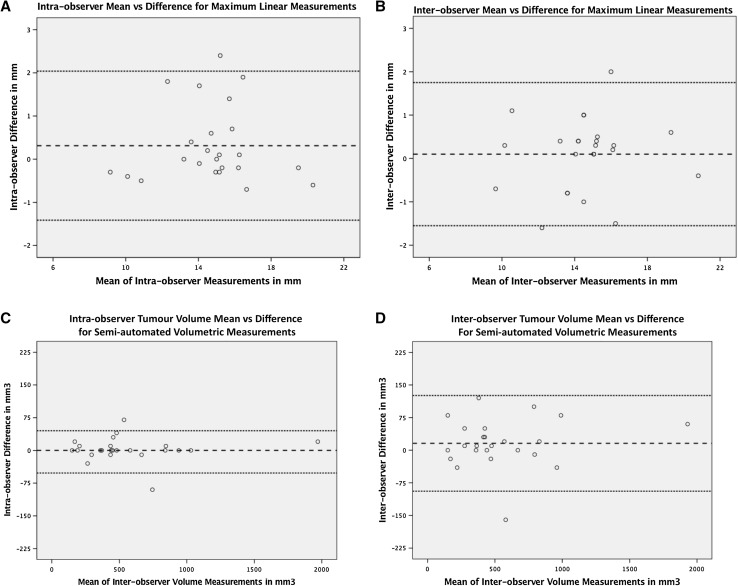
Fig. 4.
a–d Display standard Bland–Altman plots for all four paired measurement sets to show levels of intra and inter-observer agreement for linear and semi-automated volumetric measurement techniques. These plot the difference between the values against the mean for each pair of measurements. The dashed line represents the overall mean of the differences between sets of measurements. The dotted lines are calculated as ± 1.96 × SD and represent the upper and lower limits of agreement

