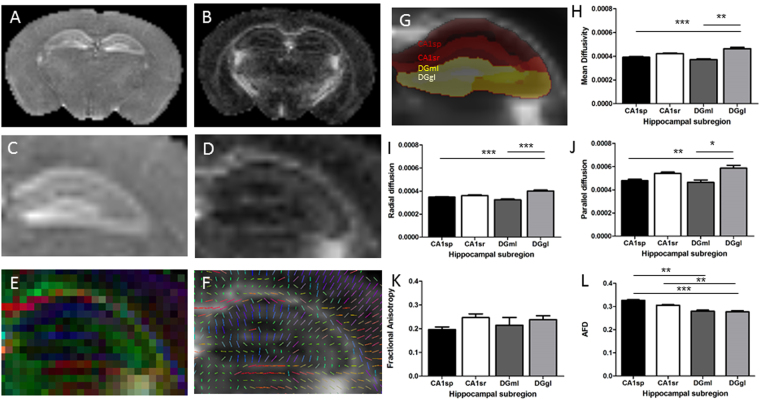
Figure 3.
MRI imaging & processing. Mean diffusivity (MD; A,C) and fractional anisotropy (FA; B,D) maps were calculated from 42-direction dMRI. Data was also visualised as RGB and line vector maps of diffusion directions (E,F). Diffusion metrics were calculated for two of the CA1 hippocampal layers (CA1sp and CA1sr) and two of the DG hippocampal layers (DGgl and DGml), illustrated in G. Variations in mean diffusivity (H), radial diffusion (I) parallel diffusion (J), fractional anisotropy (K), and apparent fibre density (L) were assessed, showing significant differences between the DGgl and other layers. *p < 0.05, **p < 0.01, ***p < 0.001.

