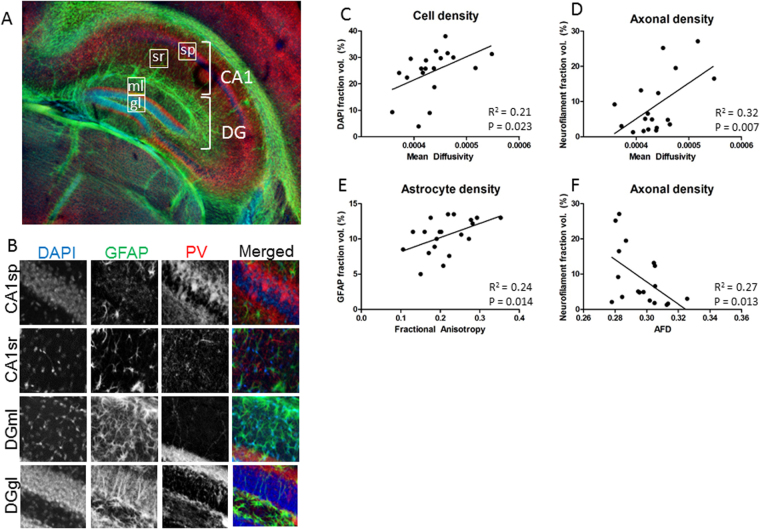
Figure 4.
Differences in diffusion in hippocampal subregions. (A,B) Cellular imaging of the hippocampus shows regional variation in microstructure. Example voxels from each hippocampal region are outlined in (A), and showed at higher magnification in (B). DAPI (cell nuclei), PV (interneuron population) and GFAP (astrocytes) are differentially distributed within the CA1sp, CA1sr, DGgl and DGml cell layers. (C) Mean diffusivity correlates with DAPI staining area, reflective of cell density. (D) Mean diffusivity also correlates with axonal density. (E) Fractional anisotropy only correlates with astrocytes staining density, as shown with GFAP. (F) Axonal density, quantified from neurofilament staining area, negatively correlated with apparent fibre density in the hippocampal subregions examined.

