Figure 7.
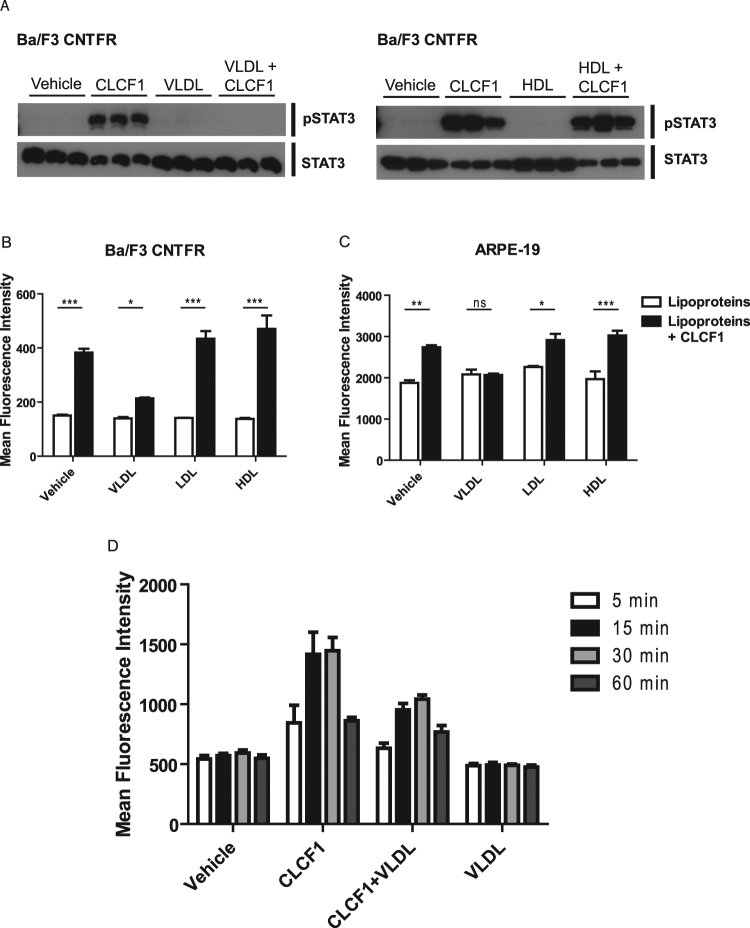
Lipoproteins modulate CLCF1-induced STAT3 tyrosine phosphorylation. (A,B) Ba/F3 transfected CNTFRα, gp130 and LIFRβ cDNA were stimulated with CLCF1 (100 ng/ml) or lipoproteins (100 μg/ml) alone or in combinations for 15 min. (C) ARPE-19 retinal epithelial cells were stimulated with CLCF1 (100 ng/ml) or lipoproteins (100 μg/ml) alone or in combinations for 5 min. (D) Ba/F3-CNTFR were stimulated with CLCF1 (100 ng/ml) or lipoproteins (100 mg/ml) alone or in combinations for 5–30 min. STAT3 tyrosine phosphorylation was assessed by Western Blot analysis (A) or by flow cytometry using intracellular staining with anti-pSTAT3 mAb (B–D). Vehicle: unstimulated cells. Histograms indicate the mean fluorescence intensity of 3 independent samples ± SD. Western blot analysis (A) is representative of 3 independent experiments. Blots were probed with antibodies specific for STAT3 or its tyrosine phosphorylated form (pSTAT3).

