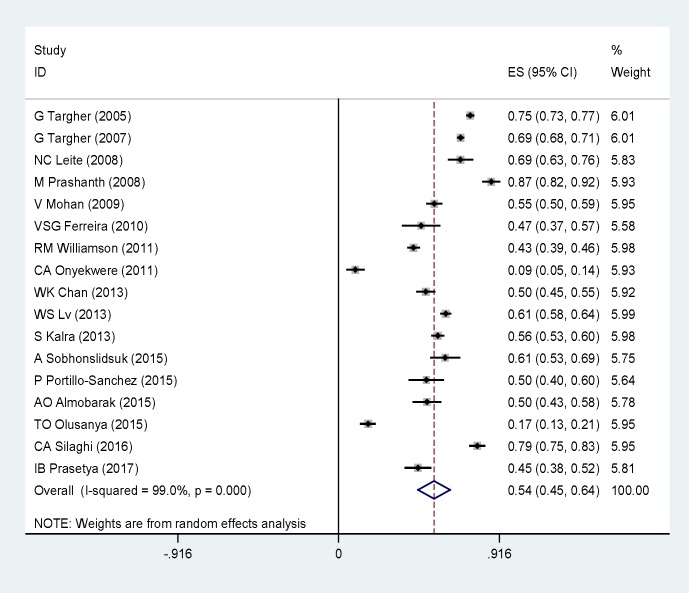
Figure 2.
The forest plot of NAFLD prevalence in type 2 diabetes patients. Square represents effect estimate of individual studies with more than 95 % confidence intervals with the size of squares proportional to the weight assigned to the study in the meta-analysis. In this chart, studies are stored in order of the year of publication and author’s names, based on a random effects model

