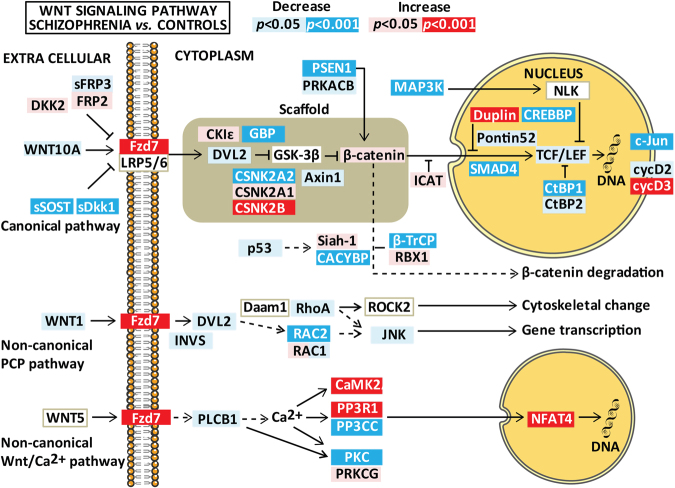
Fig. 1. Differences in Wnt pathway gene expression between patients with schizophrenia spectrum disorder and healthy controls after controlling for age, gender, and Bmal1.
Results are given as p-values where significant results (p-values adjusted for multiple testing) are indicated in red/dark blue (for increased/decreased mRNA expression) and nominally significant results (0.001 < p < 0.05) are shown as pink/light blue (for increased/decreased mRNA expression). The figure summarizes relevant genes for the three Wnt pathways (i.e., canonical pathway, non-canonical planar cell polarity pathway, and the non-canonical Wnt/Ca2+ pathway). The figure is based on the Wnt signaling pathway in the KEGG database

