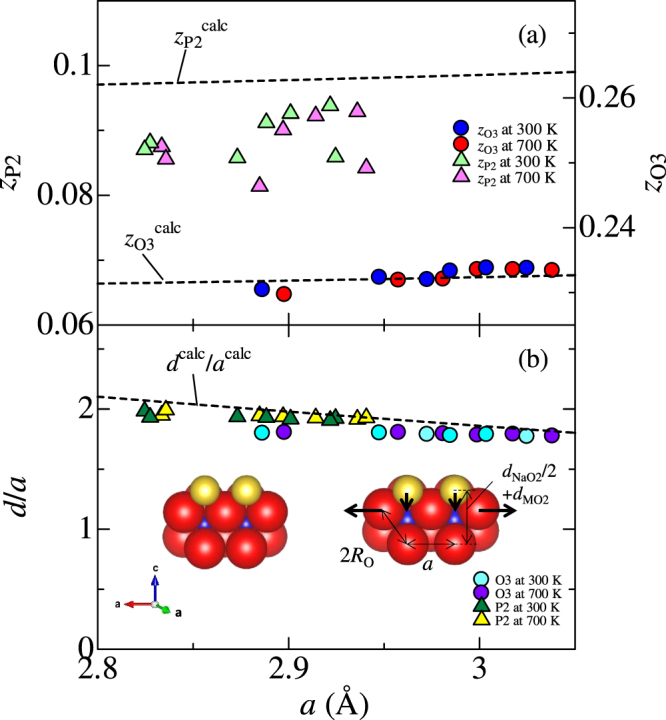
Figure 3.

(a) z coordinate of oxygen for O3- (zO3) and P2-type (zP2) structure against a-axis lattice constant (a). Blue and red circles represent zO3 at 300 and 700 K, respectively. Light green and pink triangles represent zP2 at 300 and 700 K, respectively. The broken lines represent z calculated by the hard sphere model with minimum Madelung energy for O3 and P2-type compounds ( and ) against a, respectively. (b) The ratio of interlayer distance (d) to a against a. Light blue and purple circles represent d/a of O3-type compounds at 300 and 700 K, respectively. Green and yellow triangles represent d/a of P2-type compounds at 300 and 700 K, respectively. The broken line represents d/a calculated by the hard sphere model with minimum Madelung energy (dcalc/acalc) against a. The inset of Fig. 3(b) shows a schematic view of the local atomic configuration around M.
