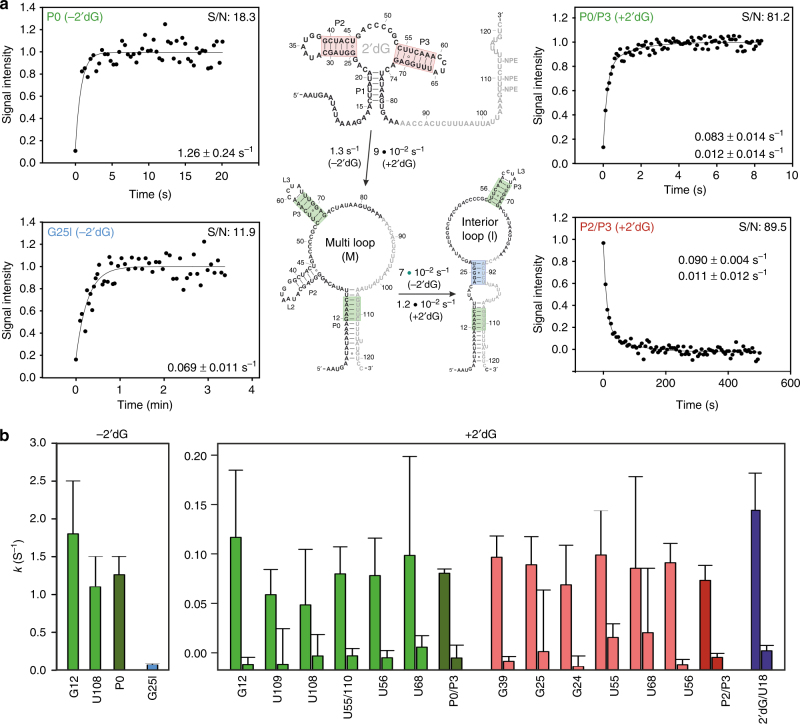
Fig. 3.
Kinetic traces for ON state folding. a Averaged kinetic traces for antiterminator PAT(M) formation in presence and absence of ligand (green), kinetic trace for antiterminator PAT(I) formation derived from the imino proton reporter signal G25I (blue), and averaged kinetic trace for aptamer dissociation in the presence of ligand (red). Dissociation and association of helical segments monitored by real-time NMR are color coded accordingly in the secondary structure depiction on the right. b Individual rates derived from transients shown in (a) and Supplementary Fig. 3. Green bars indicate rates of P0 and P3 formation in PAT(I) and PAT(M) conformations, with the dark green bar corresponding to averaged rates for complete helix formation. The blue bar shows kinetic rates for PAT(I) formation only. Red bars correspond to helix P2 and P3 dissociation in the ligand-bound state and dark red to the averaged dissociation of helix P2 and P3. The purple bar corresponds to cooperative dissociation of both the ligand 2′dG and U18 (P1). Errors correspond to the s.d. of the fit. S/N values shown correspond to the S/N ratio of the latest data point

