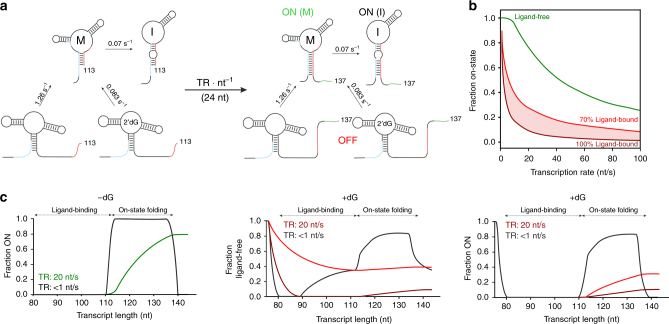
Fig. 5.
Simulations of co-transcriptional folding. a Schematic representation of interconverting transcriptional intermediates between transcript lengths 113 and 137 nt and corresponding refolding rates derived from real-time NMR experiments. b Fraction of ON state obtained at nucleotide 137 depending on the transcription rate. Individual simulations were performed for interconverting transcriptional intermediates between transcript lengths 113 and 137 nt based on interconversion rates derived from real-time NMR experiments. The following three instances were simulated: the ligand is not bound to the aptamer domain before nucleotide 113 is synthesized (ligand-free, green); ligand binding is completed by 70% (70% ligand-bound, light red) or 100% (100% ligand-bound, dark red). c Comparison of co-transcriptional folding at a transcription rate of 20 nt s−1 to equilibrium structures assuming the polymerase stalls at each nucleotide (<1 nt s−1). Equilibrium structures of transcriptional intermediates were determined previously (black trace)15. For a transcription rate of 20 nt s−1, simulations of co-transcriptional folding between transcript lengths 113 and 137 nt were fit into the corresponding graphs. The state adopted at nucleotide 137 is assumed to be maintained until the regulatory decision point. The ligand-free fraction between nucleotides 78 and 110 corresponds to a single-exponential decay resulting in either a 70% ligand-bound population at nucleotide 113 (~0.6 s−1) or a 100% ligand-bound population at nucleotide 90 (~2.3 s−1)

