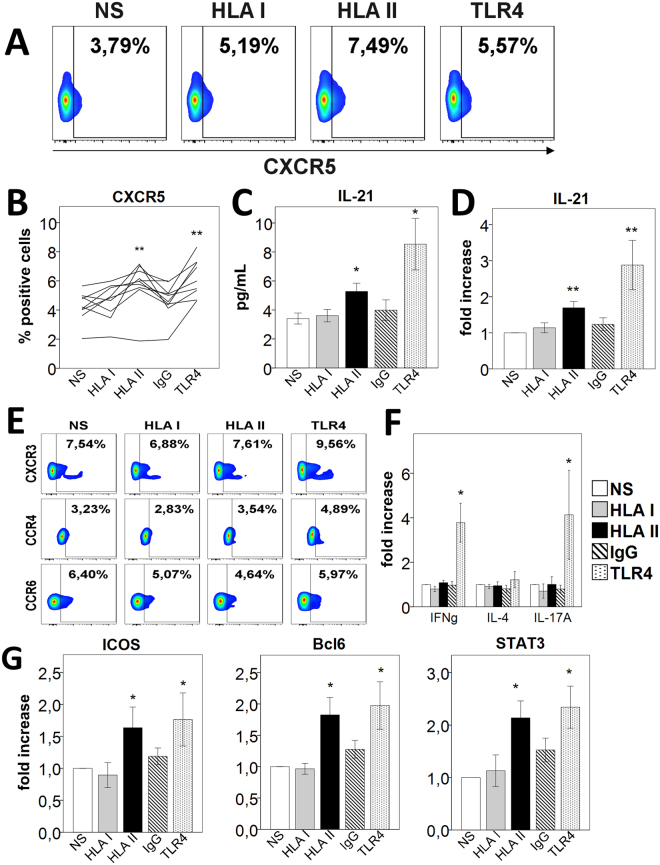
Figure 2.
HLA-II-moDCs polarize CD4+ naive T cells into a Tfh phenotype. In all experiments, CD4+ naive T cells were cocultured with stimulated moDCs for 6 days. (A) Flow cytometry analysis of CXCR5 surface expression (gated on CD4+cells). One representative experiment out of 9 performed is shown. (B) Summary analysis of the CXCR5 percentage expression. Each line represents a single experiment (n = 9). (C) Cell culture supernatants were analyzed for IL-21 production by ELISA (mean ± SEM, n = 9). (D) Summarized data for intracellular IL-21 levels by flow cytometry. Values are expressed as the fold increase in IL-21 levels compared with levels in untreated cells (mean ± SEM, n = 13). (E) Flow cytometry analysis for Th1 (CXCR3), Th2 (CCR4) and Th17 (CCR6) surface marker expression (gated on CD4+ cells). One representative experiment of 9 was shown. (F) Coculture supernatants were analyzed for IFN-γ, IL-4 and IL-17A levels by ELISA. Values are expressed as fold increase in cytokine levels compared with levels in unstimulated cells (mean ± SEM, n = 9). (G) Flow cytometry analysis for the surface expression of ICOS and the intracellular expression of Bcl-6 and pSTAT3 in CD4+45RA+ T cells stimulated with moDCs for 6 days (mean ± SEM, n ≥ 4). *p < 0.05; NS, non-stimulated; IgG, isotype control.

