Figure 1.
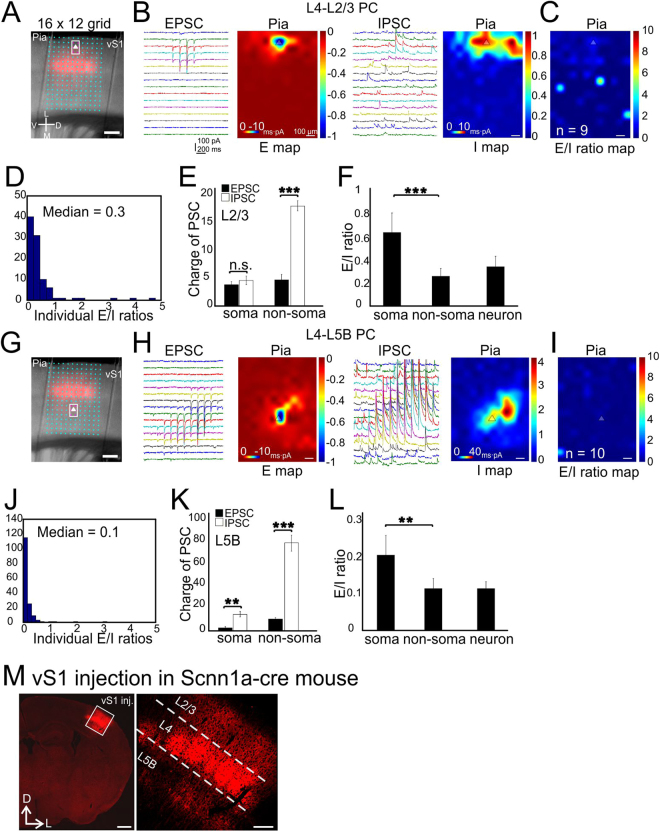
CRACM of L4-specific synapses on L2/3 and L5B PCs in vS1. (A) A 16 × 12 photostimulation grid (75 µm spacing) overlaid on a coronal slice. Pink color indicates barrels expressing mCherry fluorescent protein. The triangle indicates the soma position of an example of recorded L2/3 PC. The boxed six pixels surrounding the soma were defined as the “soma” region. Scale bar, 200 µm. (B) Traces: examples of EPSC/IPSC recorded from a single L2/3 PC. Heat maps: averaged CRACM input maps aligned by soma position (triangle). Excitatory (E) maps and inhibitory (I) maps were recorded at reversal potentials for inhibitory synaptic currents and excitatory synaptic currents, respectively. The inset scales represent the actual recorded PSC charge values and the outside scales for the E and I maps were normalized to the maximum E charge within maps. n = 9 cells, 5 mice. Scale bar: 100 µm for all the heat maps hereafter. (C) Group averages of the E/I ratio maps across pixels. Scale bar, 300 µm, applying to all heat maps hereafter. (D) Quantitative distribution of pixel E/I ratios shown in the panel C. (E) Comparisons of absolute charges between EPSCs and IPSCs for both soma and non-soma regions. (F) E/I ratios at compartmental soma, non-soma regions and of the whole neurons. (G–L) CRACM of L4-L5B PCs. Legend layout similar as above. n = 10 cells, 5 mice. *P < 0.001, n.s., not statistically significant. (M) Flex-virus injection in vS1 with Scnn1a-cre mouse. Left, low-magnification image of ChR2-mChe expressing in vS1 glutamatergic neurons; right, zoom in image. Scale bar left: 0.5 mm, scale bar right: 200 µm.

