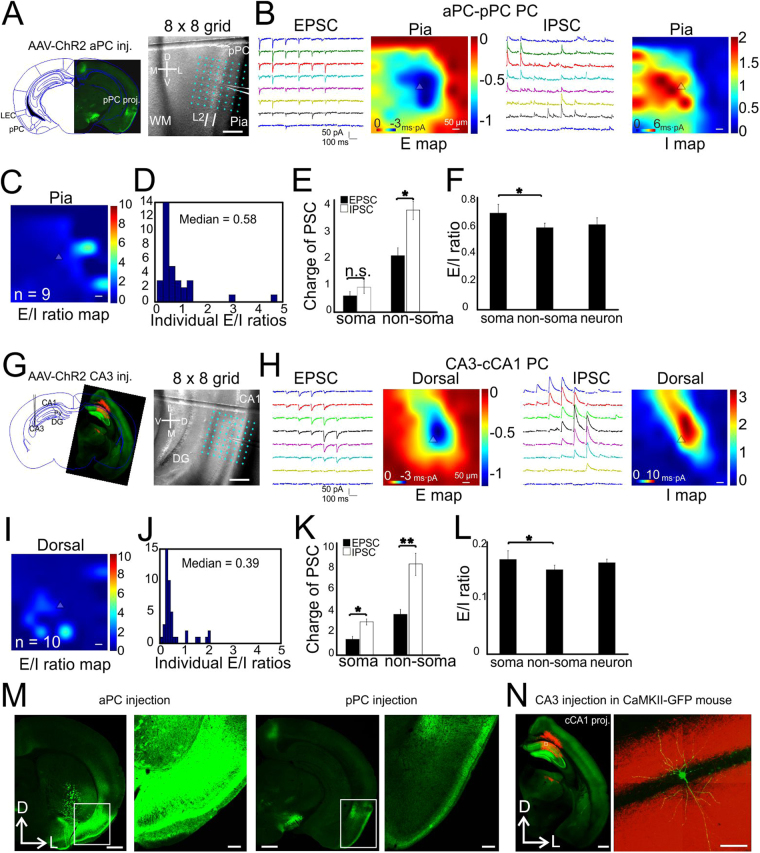
Figure 4.
CRACM of long-range synapses on PCs in piriform cortex and CA1. (A–F) aPC synapses on L2 PCs in pPC. (A) Left, overlay of a slice with AAV-ChR2-expressing projection axons in pPC onto an atlas schematic (Bregma: −2.54 mm, Paxinos and Franklin, 1997). Right, A 8 × 8 photostimulation grid (75 µm spacing) overlaid on a coronal slice with an example of recorded PC in L2. (B) Traces: examples of EPSC/IPSC recorded from a single L2 PC. Heat maps: averaged CRACM input maps aligned by soma position. (C) Group averages of the E/I ratio maps across pixels. n = 9 cells, 2 mice. (D) Quantitative distribution of pixel E/I ratios shown in panel C. (E) Comparisons of absolute charges between EPSCs and IPSCs for both soma and dendrites regions. (F) E/I ratios at compartmental soma, dendrites regions and of the whole neurons. (G–L) CA3 synapses on contralateral CA1 PCs (stratum pyramidale). Legend layout similar as above. n = 10 cells, 3 mice. *P < 0.05, **P < 0.01, n.s., not significant. (M) Low and high magnification of one example of a coronal slice showing aPC injection and pPC projection. Scale bars in low-mag: 0.5 mm, scale bars in high-mag: 200 µm. (N) Virus injection in CA3 with GAD67-GFP mouse. Left, low-magnification image of ChR2-mChe expressing in contralateral CA1; right, Alexa-488 filled PCs during CRACM experiments. Scale bars: left 0.5 mm, right 50 µm.

