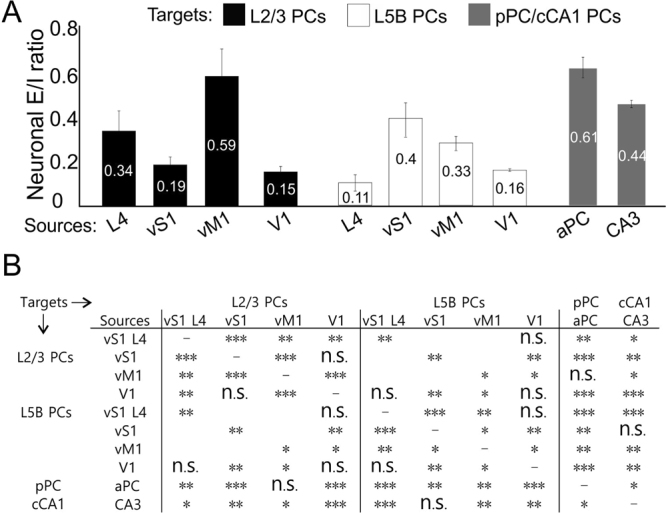
Figure 5.

Summary of E/I ratios and comparisons across different recording targets and input cortical sources. (A) Neuronal E/I ratios across layers and cortical regions. (B) Statistical comparisons of neuronal E/I ratios between layers for same input sources and between same targets for different input sources. Nonparametric Wilcoxon signed-rank test, comparisons within same layers: L2/3: L4 vs vS1 P = 0.007, L4 vs vM1 P = 0.003, L4 vs V1 P = 0.006, vS1 vs vM1 P = 0.000, vS1 vs V1 P = 0.4782, vM1 vs V1 P = 0.000; L5B: L4 vs vS1 P = 0.000, L4 vs vM1 P = 0.003, L4 vs V1 P = 0.393, vS1 vs vM1 P = 0.047, vS1 vs V1, P = 0.008, vM1 vs V1 P = 0.011; comparisons between L2/3 and L5B: L4 P = 0.005, vS1 P = 0.004, vM1 P = 0.031, V1 P = 0.835; comparisons between neocortex L2/3 and paleocortex: L4 vs aPC P = 0.006, vS1 vs aPC P = 0.000, vM1 vs aPC P = 0.912, V1 vs aPC P = 0.000, L4 vs CA3 P = 0.043, vS1 vs CA3 P = 0.002, vM1 vs CA3 P = 0.039, V1 vs CA3 P = 0.000; comparisons between neocortex L5B and paleocortex: L4 vs aPC P = 0.000, vS1 vs aPC P = 0.009, vM1 vs aPC P = 0.002, V1 vs aPC P = 0.000, L4 vs CA3 P = 0.000, vS1 vs CA3 P = 0.751, vM1 vs CA3 P = 0.009, V1 vs CA3 P = 0.002; comparisons between aPC and CA3: P = 0.034.
