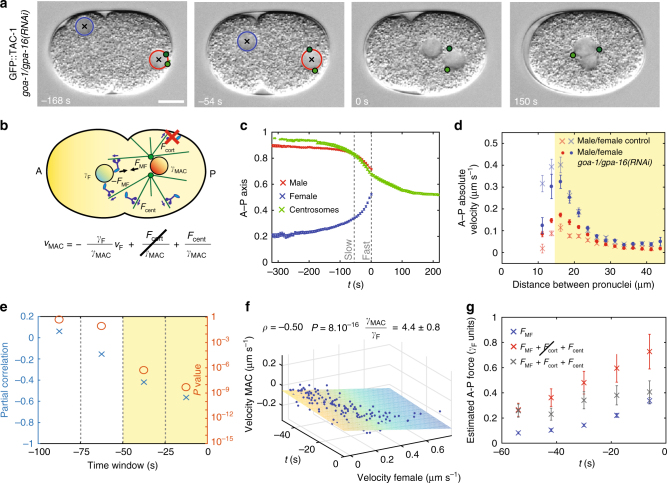
Fig. 3.
Pronuclear migration and centration upon depletion of cortical forces. a, b Snapshots and schematics of pronuclei and centrosomes in goa-1/gpa-16(RNAi) embryos. c Average pronuclear and centrosome midpoint positions along the A–P axis as a function of time, with S.E.M. (pronuclei: n = 31, centrosomes: n = 13). d Absolute average pronuclear velocities, with S.E.M., as a function of the distance separating them in the indicated conditions (control, n = 33, same as Fig. 1e; goa-1/gpa-16(RNAi), n = 31; here and in e, f, velocities are calculated between successive frames 6 s apart). The velocities during the acceleration phase of the female pronucleus in control and goa-1/gpa-16(RNAi) embryos are compatible (d > 15 µm, highlighted in yellow; χ2 = 12; P = 0.37), whereas those of the male-asters complex are not (χ2 = 70; P < 2 × 10⁻¹⁰). e Partial Pearson's correlation, controlling for time variation, between pronuclear velocities along the A–P axis over successive time windows (n = 31). Here and in other figures, each time point corresponds to a time window of 25 s and the correlated time window (P < 0.05) is highlighted in yellow (partial correlation: blue crosses; P value (Student's t test, two-sided): orange circles). f Velocity of male pronucleus as a function of time and velocity of the female pronucleus during the correlated phase of pronuclear migration in goa-1/gpa-16(RNAi) embryos (n = 31, −50 < t < 0 s time window). Plane: linear fit . Here and in Fig. 4f, the Pearson’s partial correlation coefficient ρ between the velocities of the male-aster complex (or asters pair) and female pronucleus, controlling for time variation, its P value (Student’s t test, two-sided) and the fitted ratio between the drag coefficients of the male-asters complex (or asters pair) and female pronucleus are indicated. g Estimated A–P forces (with S.E.M.) acting on the male-asters complex and female pronucleus shortly before their meeting. Blue: force between pronuclei (n = 31). Red: sum of forces acting between pronuclei and centering force (n = 31). Gray: total force acting on male-asters complex in control embryos (n = 33). Here and in Fig. 4g, force is expressed in units of the drag of the female pronucleus, estimated to be ~130 pN s μm−1 (Methods)

