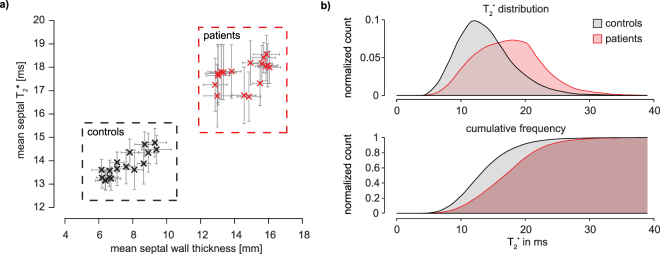
Figure 4.
(a) Scatter plot of septal wall thickness and T2* in HCM patients and healthy controls at 7.0 T. Each marker corresponds to one cardiac phase. Errorbars indicate SEM. Two clusters for patients and for volunteers can clearly be separated using mean septal T2* and wall thickness. (b) Histogram (top) and cumulative frequency plot (bottom) of T2* in the mid ventricular septum. Combined data from six healthy volunteers and six HCM patients for all cardiac phases. A clear shift toward higher T2* can be observed in the HCM patients.

