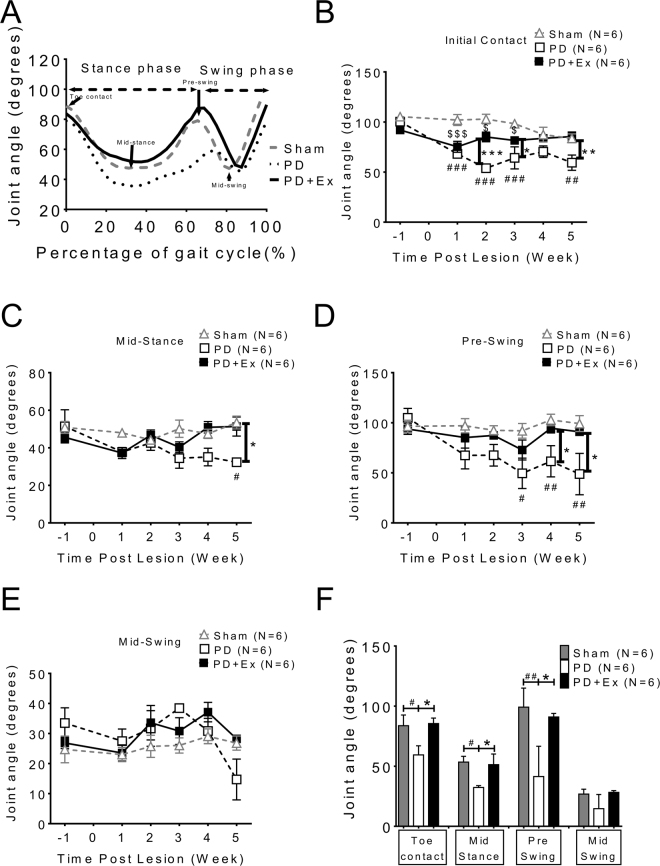
Figure 5.
Kinetic parameters examined at four specific stages during locomotion: analysis of dynamic changes in ankle angle during the gait cycle. (A) Angular trajectories of the ankle joint of a sham rat (gray dotted line) a PD rat (black dotted line) and PD with exercise rat (solid line) in a full gait cycle were measured. The stance and swing phases were normalized to percentage of a full gait cycle of 100% (X-axis). The arrows indicate the beginning of the stance phase (toe contact), mid-stance, pre-swing, and mid-swing in the gait cycle. Not only in stance phase but also in initial swing phase (pre-swing stage), the ankle angle of PD was smaller than that of sham animals. (B) Measurements of ankle joint angles at four specific time points in normal and PD rats. Data are averaged by four weeks’ (post-lesion 2nd to 5th week) and presented as mean ± SEM. *which indicated a significant difference (p < 0.05) between the PD and PD with exercise animals in toe contact, mid-stance and pre-swing phases (unpaired Student t tests).

