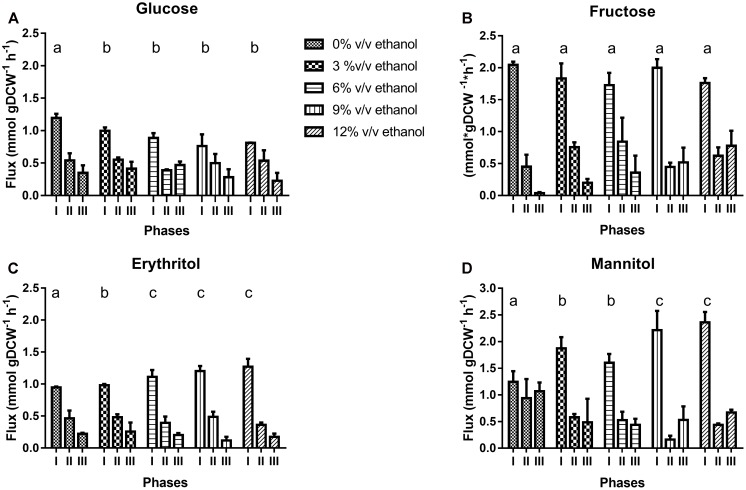
FIGURE 3.
Specific consumption of glucose (A), and fructose (B) and concomitant specific production of the related products, erythritol (C) and mannitol (D). during cultivation of O. oeni PSU-1 under increasing ethanol contents. Statistical analysis only was performed in phase I and shared letters indicate no significant difference (Mood test, p < 0.05).

