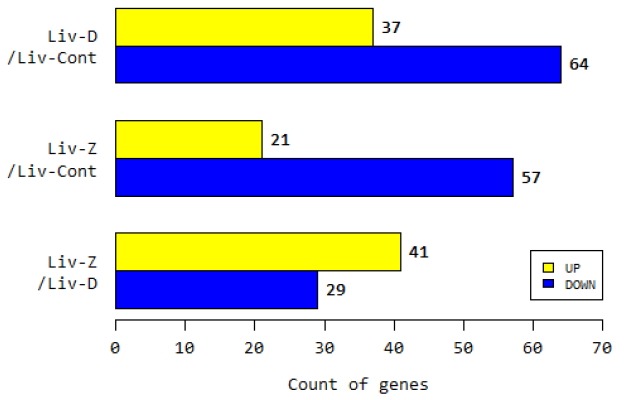
Figure 1.

Expression counts of differentially expressed genes (DEGs) in control, deoxynivalenol (DON), and zerolenone (ZEN) treatment groups. The y-axis represents upregulation and downregulation of DEGs between control livers and mycotoxin-treated livers. The x-axis represents the total number of transcripts (DEGs for each pairwise comparison were considered at fold change [FC]>2 and p≤0.05).
