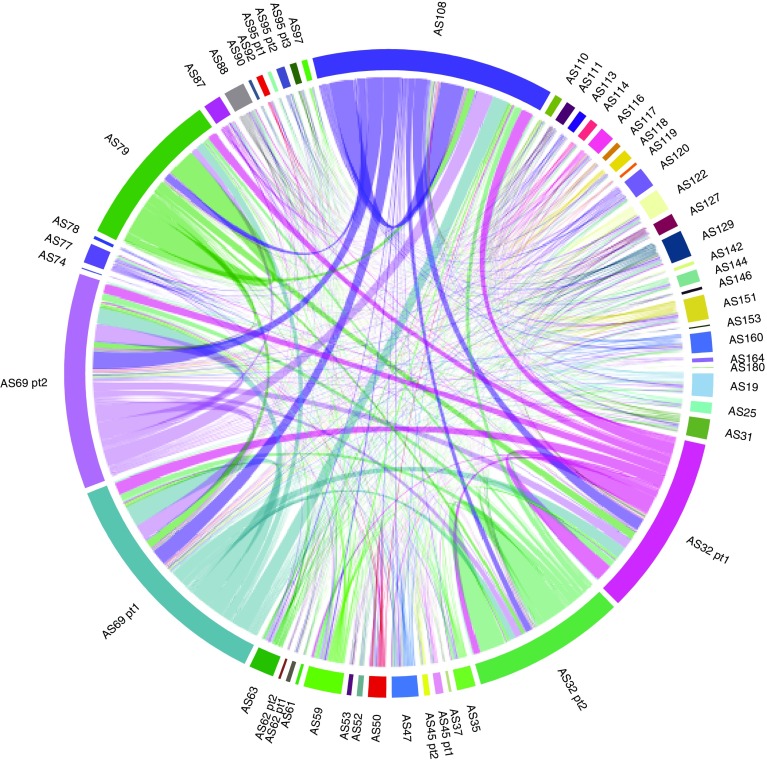
Fig. 4.
Ancillary studies performed on the same TrialNet donors. Chord diagram of the components (TN ancillary studies, designated AS) and their interactions (connecting lines). Studies that analysed the same TrialNet donors are connected by lines: the wider the line, the higher the number of individuals common to the different ancillary studies. The scale and width of the TrialNet ancillary study component reflects the number of donors shared across other TrialNet ancillary studies

