Figure 6.

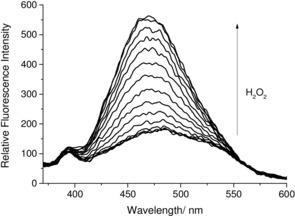
Fluorescent spectra of DAPOX‐BPin (30 nm) with the addition of H2O2 (0 mm −21 mm) in pH 7.25 buffer solution (52.1 wt % MeOH) with a 10 min wait between each measurement. λ ex=350 nm; slit widths: excitation: 10 nm, emission: 10 nm.

Fluorescent spectra of DAPOX‐BPin (30 nm) with the addition of H2O2 (0 mm −21 mm) in pH 7.25 buffer solution (52.1 wt % MeOH) with a 10 min wait between each measurement. λ ex=350 nm; slit widths: excitation: 10 nm, emission: 10 nm.