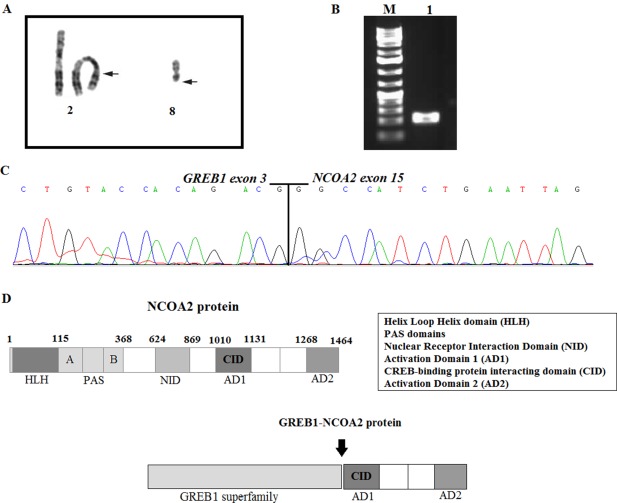
Figure 2.

A, Partial karyotype showing the translocation t(2;8)(p25;q13). Breakpoint positions are indicated by arrows. B, Gel electrophoresis showing the amplified cDNA fragments. M, 1 Kb DNA ladder (GeneRuler, ThermoFisher); lane 1, amplification of cDNA fragment using the primers GREB1–518F/NCOA2–3377R1. C, Partial sequence chromatogram of the amplified cDNA fragment showing the junction point of the GREB1‐NCOA2 fusion. D, Illustration of the protein NCOA2 and chimeric GREB1‐NCOA2. All domains are shown, the arrow is pointing at the breakpoint position [Color figure can be viewed at wileyonlinelibrary.com]
