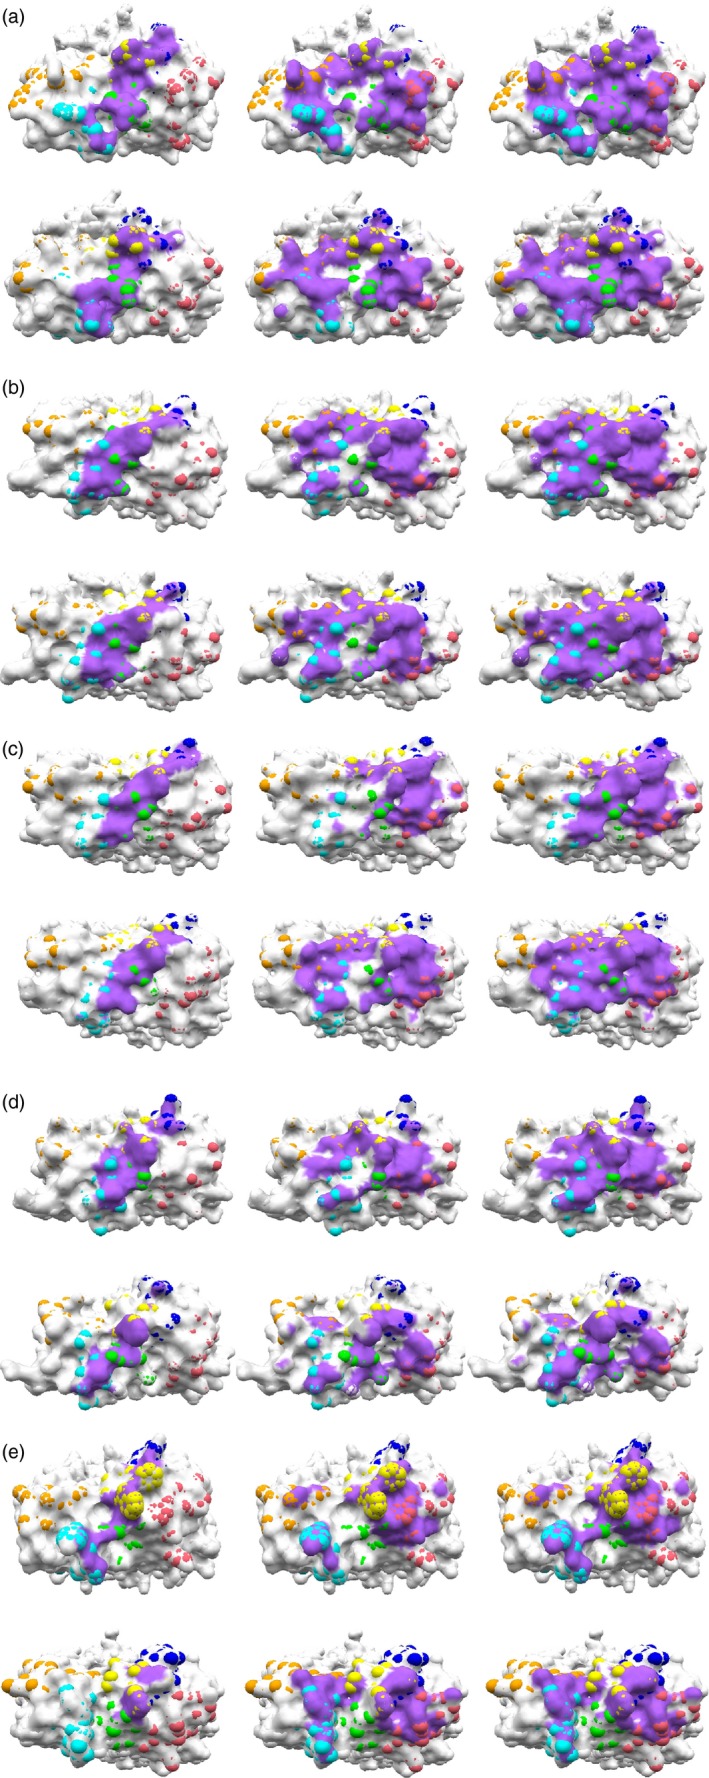
Figure 2.

T‐cell receptor (TCR) regions interacting with peptide–MHC (pMHC). (a–e) MHC and peptide‐binding footprints on TCR surface in B3K506, 14.C6, J809.B5, 2W20 and YAe62, respectively, in the crystal structure (upper figures) and the MD snapshot at 200 ns (lower figures). From left to right, the binding footprints of peptide, MHC and pMHC, respectively, are shown in purple. CDR regions are defined based on the IMGT 3D structure‐DB 39 and Dunbrack definition,40 as summarized in Table 2 for CDR3 loops, and shown in Figure 3. CDR1α–3α and CDR1β–3β are coloured cyan, orange, green, blue, pink and yellow, respectively. [Colour figure can be viewed at wileyonlinelibrary.com]
