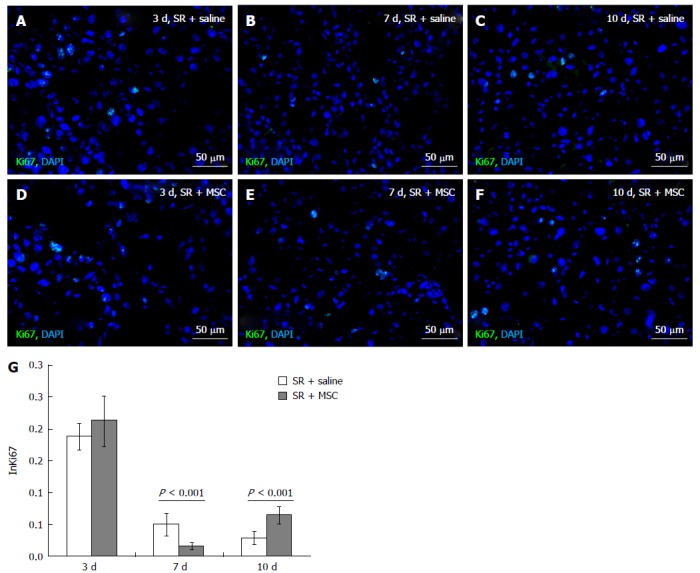
Figure 2.

Influence of the multipotent stromal cells transplantation on Ki67 index of hepatocytes. Ki67 expression in the residual livers at 3 (A, D), 7 (B, E) and 10 d (C, F) after the surgery; cell nuclei are counterstained DAPI (blue); Index of Ki67+ hepatocytes is plotted against time after the surgery (G): Horizontal axis represents time elapsed after the surgery, vertical axis represents Ki67 proliferation index (InKi67) of hepatocytes; White columns represent hepatocyte proliferation in the comparison group, gray columns represent hepatocyte proliferation in the multipotent stromal cells transplantation group; The data is presented as mean values with confidence intervals. SR: Subtotal resection; MSC: Multipotent stromal cells.
