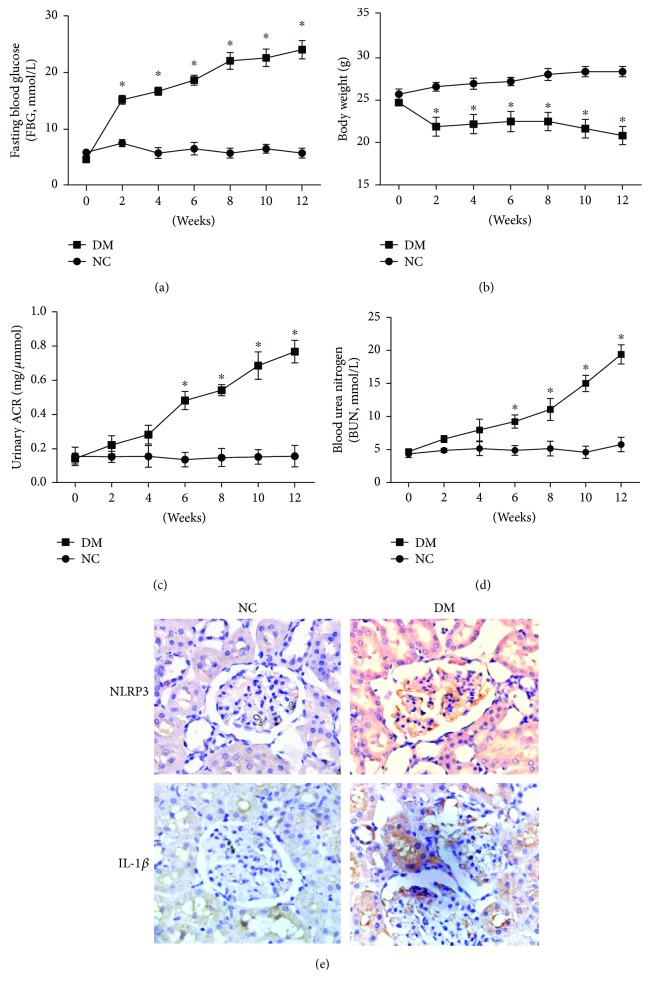
Figure 1.
STZ-induced changes in FBG, body weight, ACR, and renal function of diabetic mouse. Male C57BL/6 mice were divided into diabetes mellitus group (DM group, n = 10) and normal control group (NC group, n = 10). Every two weeks, fasting blood glucose (a), body weight (b), ACR (c), and BUN (d) levels were examined. (e) STZ-induced expression of NLRP3 and IL-1β in renal tissue was observed by immunohistochemistry and light microscopy (200×). Data are presented as means ± SD. ∗p < 0.05 versus NC group at the same treatment time.

