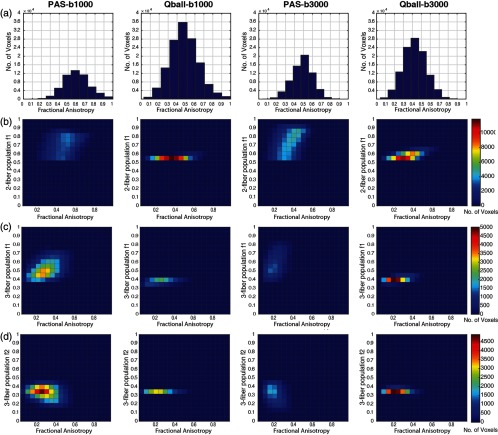
Fig. 5.
Peak fraction of PAS and Q-ball across eleven single scans for -values of and . (a) Histogram depicting the number of voxels mapped as a function of FA. (b) of two fiber populations as function of FA with number of voxels as the third dimension. (c) of three fiber populations as function of FA with number of voxels as the third dimension. (b) of three fiber populations as function of FA with number of voxels as the third dimension.

