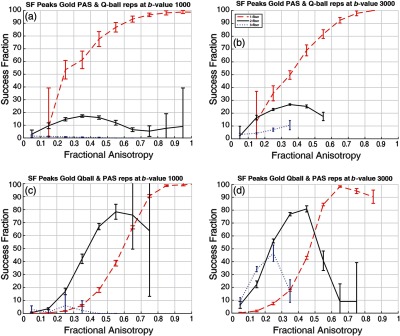
Fig. 8.

(a) SF gold standard model PAS and test models Q-ball at value of . (b) SF gold standard model PAS and test models Q-ball at value of . (c) SF gold standard model ball and test models PAS at value of . (d) SF gold standard model Q-ball and test models PAS at value of . Error bars represent standard deviation across the bin.
