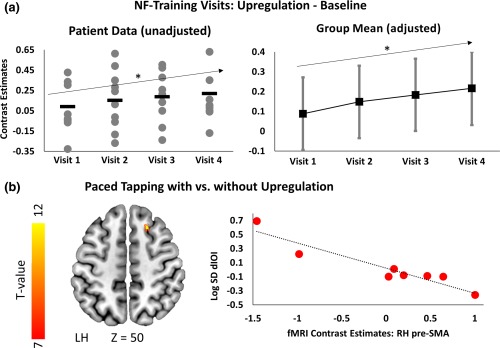
Figure 2.

Neurofeedback training and upregulation results. (a) Plots show target ROI activation for upregulation compared to baseline for each of the four training visits. Left plot shows the unadjusted data for each participant at each visit (grey dots) and the group mean (black dash). Right plot shows adjusted means (for age and caudate volume) with 95% CI derived from the linear mixed model (black squares). In both cases, target ROI activity significantly increases from the first to the last training visit (*p < .05). (b) Superimposed on a T1 template on left are the significant voxels with the target‐ROI (small‐volume corrected, t value ≥ 7, p < .001 voxel uncorr., p < .05 FWE cluster corr) showing a correlation between reduced paced tapping inter‐onset interval variability (log SD dIOI) and increased activation of the right pre‐SMA during tapping with upregulation compared to tapping without upregulation after neurofeedback training. Upregulating pre‐SMA activity therefore had a beneficial effect on tapping performance (reduced variability). Scatter plot on right plots fMRI contrast estimates (tapping versus baseline with upregulation compared to without) from the right pre‐SMA cluster as a function of log SD dIOI change during tapping with versus without upregulation (red dots). Regression slope is shown in black dotted line. Pre‐SMA = pre‐supplementary motor area. Z‐coordinates are in MNI space
