
Figure 2.
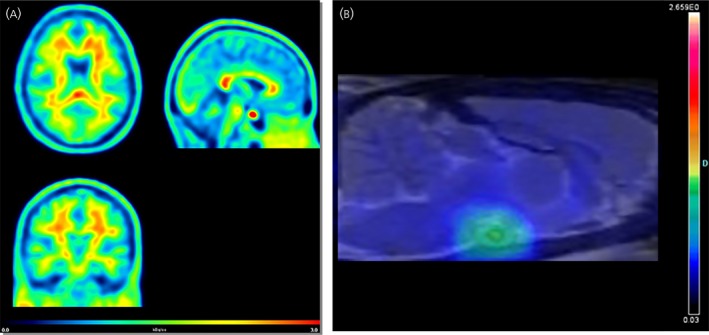
(A) Positron emission tomography (PET) images of the distribution of the oestrogen receptor tracer 16α‐[18F] fluoro‐17ß‐oestradiol ([18F]FES) in the brain of a healthy postmenopausal woman. The images were acquired 60‐90 min after injection of 200 MBq of [18F]FES. Tracer uptake is presented as kBq/cc images. The pituitary is clearly visible as a hotspot (red) in the sagittal image (top right). In addition, the images mainly show uptake in white matter. (B) PET scan of a naïve female rat brain, 60‐90 min after injection of 25 MBq of [18F]FES. The PET scan is co‐registered with a magnetic resonance imaging template of the brain to provide an anatomical reference. The highlighted spot represents the activity of the tracer in the pituitary/hypothalamus