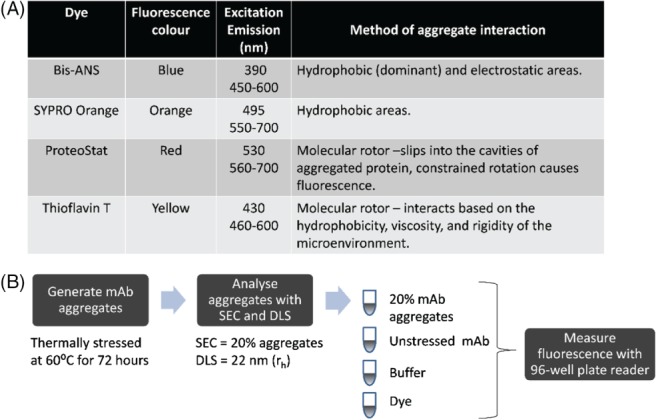
Figure 1.

Selected dyes and spiking experiment method. (A) Aggregation detection mechanism of each dye. Table shows the excitation and emission conditions used in this study and the method by which each dye interacts with aggregates. (B) Spiking experiment method to generate aggregates for the spiking experiment. The aggregates were then measured by SEC and DLS and shown to have 20% aggregates with a hydrodynamic radius of 22 nm. To measure aggregation, the aggregate stock diluted to 1 mg mL‐1 combined with the dye in a 96 well plate. The aggregate stock was spiked into unstressed IgG1 mAb A to generate different percentages of aggregates.
