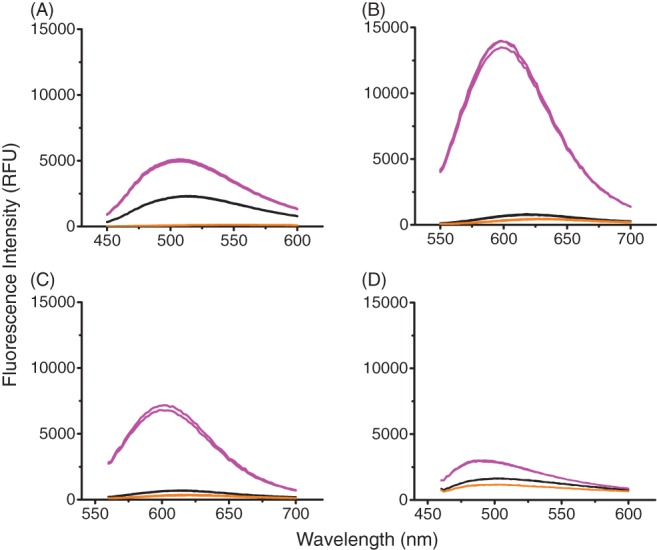
Figure 2.

Fluorescence spectrum of dyes with mAb aggregates spiked into buffer. Thermally stressed IgG1 mAb A spiked into non‐aggregated mAb. Concentration of antibody in each well was 1 mg mL‐1. This was performed in triplicate. (A) 50 µmol L‐1 Bis‐ANS, ex/em‐ 390/450–600 nm, gain 70; (B) 5X SYPRO Orange, ex/em‐ 495/550–700 nm, gain 100; (C) 3 µM ProteoStat, ex/em‐ 530/560–700 nm; (D) 50 µmol L‐1 Thioflavin T, ex/em‐ 460–600 nm, gain 110.  0% spiked aggregates
  10 % spiked aggregates
  Buffer Blank.
