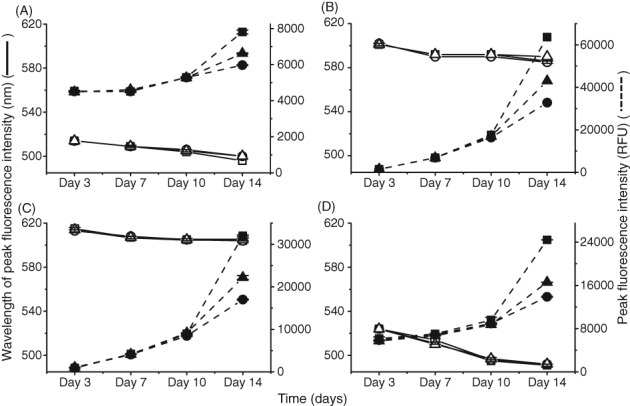
Figure 4.

Comparison of change in peak fluorescence intensity and peak wavelength in three clarified null cell cultures shake flasks. Supernatants were separated by centrifugation and filtration before measuring adding dye and measuring fluorescence. Comparison of decrease in wavelength at which highest fluorescence occurs (degree of blue shift) against increasing fluorescence intensity with increasing amount aggregates. Concentration of antibody in each well was 1 mg mL‐1. This was performed in duplicate. (A) 50 µmol L‐1 Bis‐ANS, ex/em‐ 390/450–600 nm, gain 70 (wavelength SD = 1 nm, peak intensity SD = 108 RFU); (B) 5X SYPRO Orange, ex/em‐ 495/550–700 nm, gain 100 (wavelength SD = 1 nm, peak intensity SD = 603 RFU); (C) 3 µmol L‐1 ProteoStat, ex/em‐ 530/560–700 nm (wavelength SD = 1 nm, peak intensity SD = 449 RFU); (D) 50 µmol L‐1 Thioflavin T, ex/em‐ 430/460–600 nm, gain 110 (wavelength SD = 1 nm, peak intensity SD = 505 RFU).  Shake Flask 1
  Shake Flask 2
  Shake Flask 3
  Shake Flask 1
  Shake Flask 2
  Shake Flask 3.
