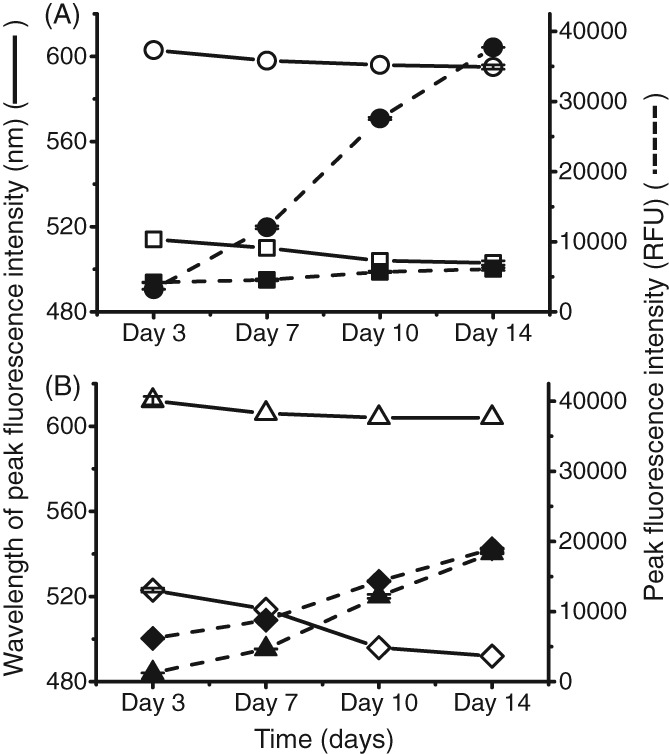
Figure 5.

Peak height and peak wavelength against mAb clarified cell cultures. The dyes were spiked into wells containing clarified IgG1 mAb B from different time points. Supernatants were separated by centrifugation and filtration before measuring adding dye and measuring fluorescence. Comparison of decrease in wavelength at which highest fluorescence occurs (degree of blue shift) against increasing fluorescence intensity with increasing amount aggregates. Concentration of antibody in each well was 1 mg mL‐1. (A) 50 µmol L‐1 Bis‐ANS, ex/em‐ 390/450–600 nm, gain 70 (wavelength SD = 1 nm, peak intensity SD = 200 RFU); 5X SYPRO Orange, ex/em‐ 495/550–700 nm, gain 100 (wavelength SD = 1 nm, peak intensity SD = 207 RFU); (B) 3 µmol L‐1 ProteoStat, ex/em‐ 530/560–700 nm (wavelength SD = 2 nm, peak intensity SD = 278 RFU); 50 µmol L‐1 Thioflavin T, ex/em‐ 430/460–600 nm, gain 110 (wavelength SD = 1 nm, peak intensity SD = 122 RFU).  Bis‐ANS
  SYPRO Orange
  Bis‐ANS
  SYPRO Orange
  ProteoStat
  Thioflavin
  ProteStat
  Thioflavin.
