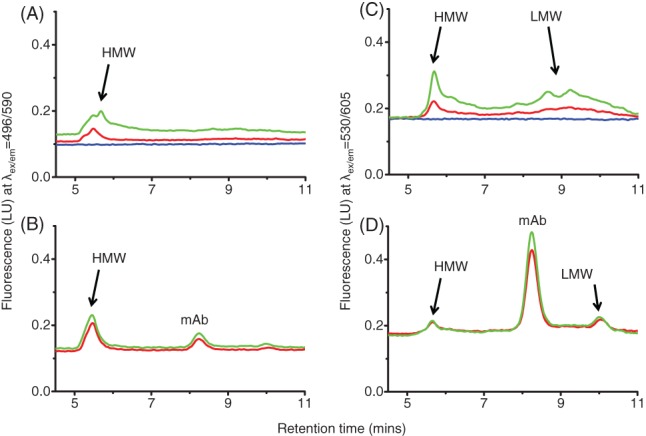
Figure 8.

SEC of mAb and null clarified cell cultures with SYPRO Orange and ProteoStat. (A) Null cell line shake flask 1 with 5× SYPRO Orange; (B) IgG mAb B with 5× SYPRO Orange; (C) null cell line shake flask 1 with 3 µmol L‐1 ProteoStat; (D) IgG mAb B with 3 µmol L‐1 ProteoStat. Clarified cell culture samples were combined with dye before loading onto the column. A TSKgel2000SWI column (7.8×300 mm) with a flow rate of 0.5 mL min‐1 with a fluorescence detector was used. SYPRO Orange samples ex/em 495/590 nm, ProteoStat samples ex/em 530/605 nm. Running buffer composed of 100 mmol L‐1 sodium phosphate (monobasic), 400 mmol L‐1 sodium chloride, pH 6.8. Injection volume of 50 µL.  Media
Media  Day 10
  Day 14.
