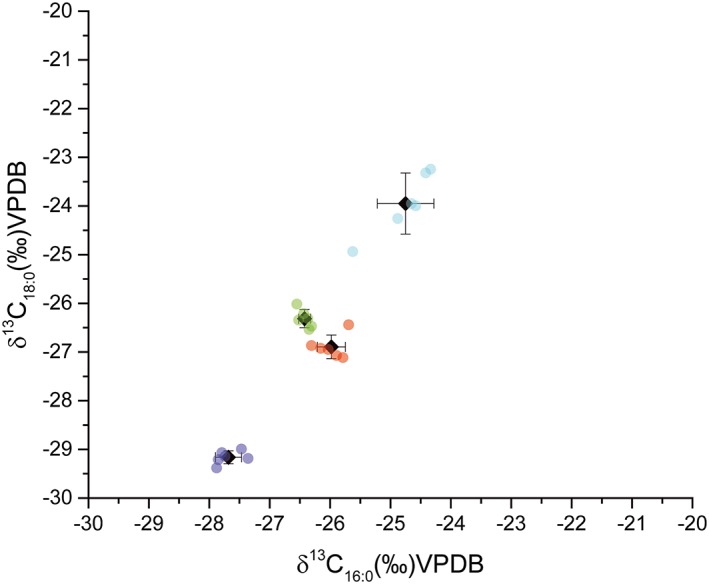
Figure 4.

An example of intra‐laboratory variability in compound‐specific stable isotope measurements. Four pottery sherds were sampled by drilling and the resulting powder homogenized. Aliquoted subsamples were distributed to three different analysts at the University of York and extracted in duplicate according to established protocols.51 Plot shows the δ 13C values of palmitic (C16:0) and stearic acid (C18:0), following calibration and correction for derivatization, for each separate extract and the mean and standard deviation of each sherd. Each sherd is represented by an individual color [Color figure can be viewed at wileyonlinelibrary.com]
