Figure 5.

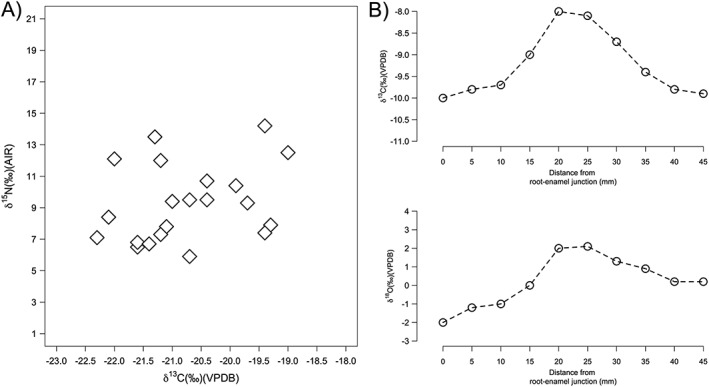
A) Example of differential scaling of δ 15N and δ 13C values in a scatterplot. B) Example of differential scaling in a sequential plot of δ 13C and δ 18O values of tooth enamel

A) Example of differential scaling of δ 15N and δ 13C values in a scatterplot. B) Example of differential scaling in a sequential plot of δ 13C and δ 18O values of tooth enamel