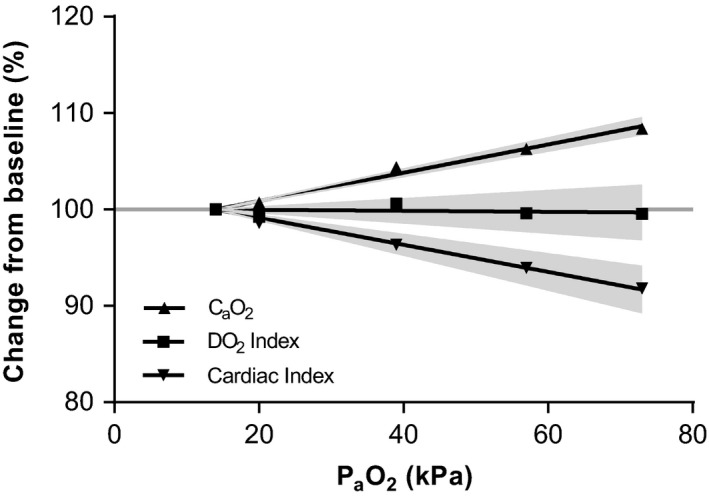
Figure 1.

Relation between oxygen content, delivery, and CI. Oxygen content increased linearly with increasing PaO2. Inversely, CI decreased, which resulted in a stable DO 2I over the entire PaO2 range. Gray areas indicate 95% confidence intervals of the fitted curve. PaO2, arterial oxygen tension; CaO2, arterial oxygen content; DO 2I, arterial oxygen delivery index; CI, Cardiac index
