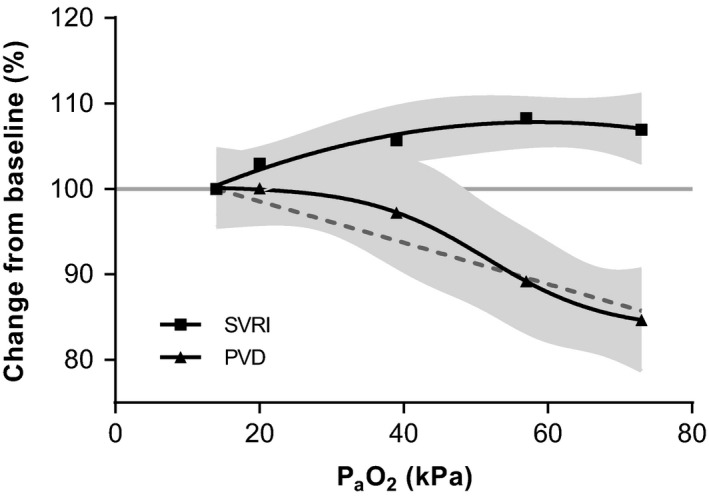
Figure 2.

Dose‐response for PVD and SVRI. Sublingual PVD decreases in a sigmoidal fashion upon increase PaO2. SVRI shows the largest increase up to 54 kPa. Gray areas indicate 95% confidence intervals of the fitted curves. For PVD, the dotted line represents the best‐fit line based on linear regression (line is plotted without 95% CI). PaO2, arterial oxygen tension; SVRI, systemic vascular resistance index; PVD, perfused vessel density; CI, Cardiac index
