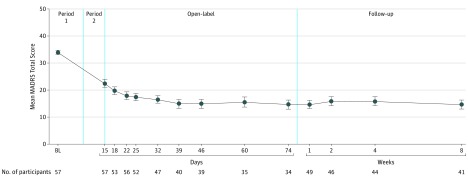
Figure 3. MADRS Total Score: Mean Change in Montgomery-Åsberg Depression Rating Scale (MADRS) Total Score From Baseline to Follow-up End Point for Participants Who Entered the Open-Label Phase.
Period 1 (days 1-8), period 2 (days 8-15), open-label period (days 15-74), and the follow-up period (days 74-130) are discussed in the Design section of the Methods and shown in the vertical axis of Figure 1. BL indicates baseline; error bars, SE.

