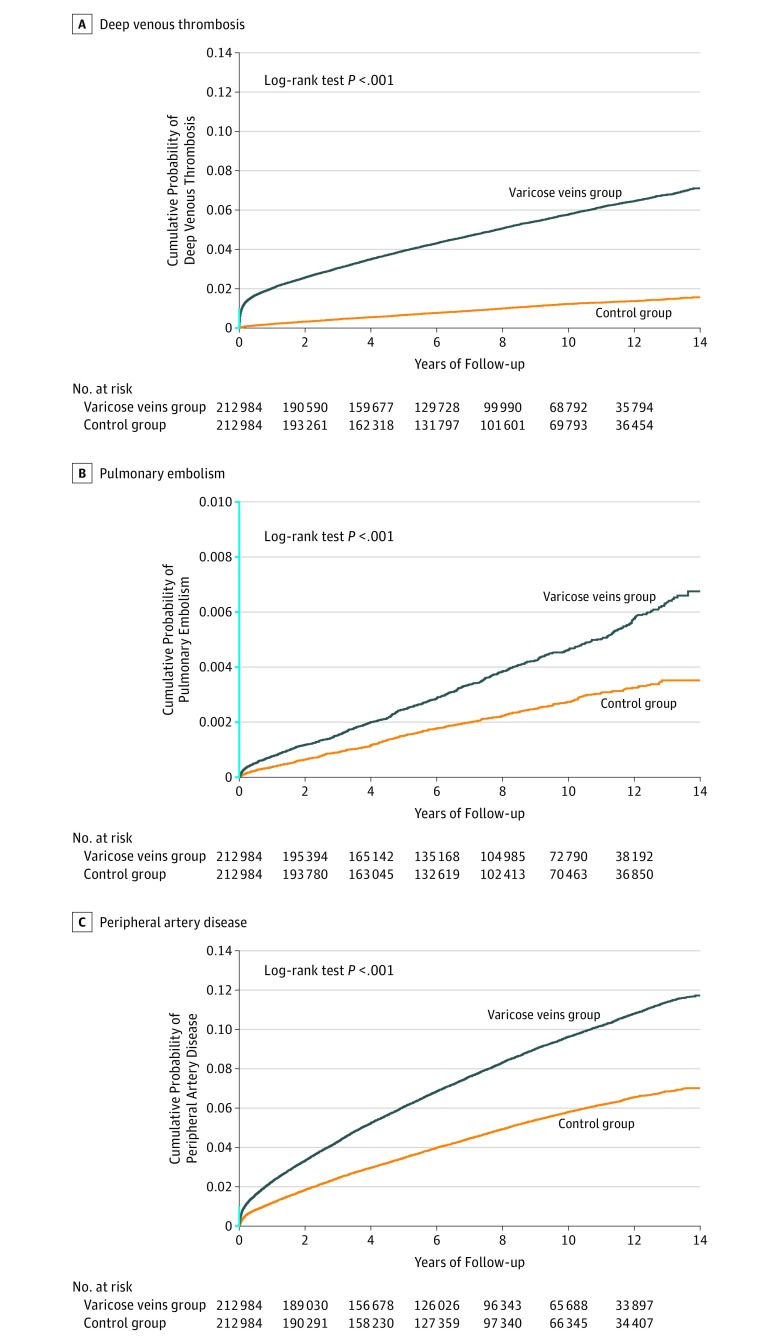
Figure. Time to Occurrence of Deep Venous Thrombosis, Pulmonary Embolism, and Peripheral Artery Disease in the Varicose Veins Group and the Propensity Score–Matched Control Group.
The segment of the y-axis shown in blue indicates range from 0 to 0.01.
A, Median duration of follow-up was 7.5 years (interquartile range [IQR], 4.0-10.8) for the varicose veins group and 7.6 years (IQR, 4.2-10.9) for the control group.
B, Median duration of follow-up was 7.8 years (IQR, 4.4-11.1) for the varicose veins group and 7.7 years (IQR, 4.2-11.0) for the control group.
C, Median duration of follow-up was 7.3 years (IQR, 3.7-10.7) for the varicose veins group and 7.4 years (IQR, 3.8-10.7) for the control group.

