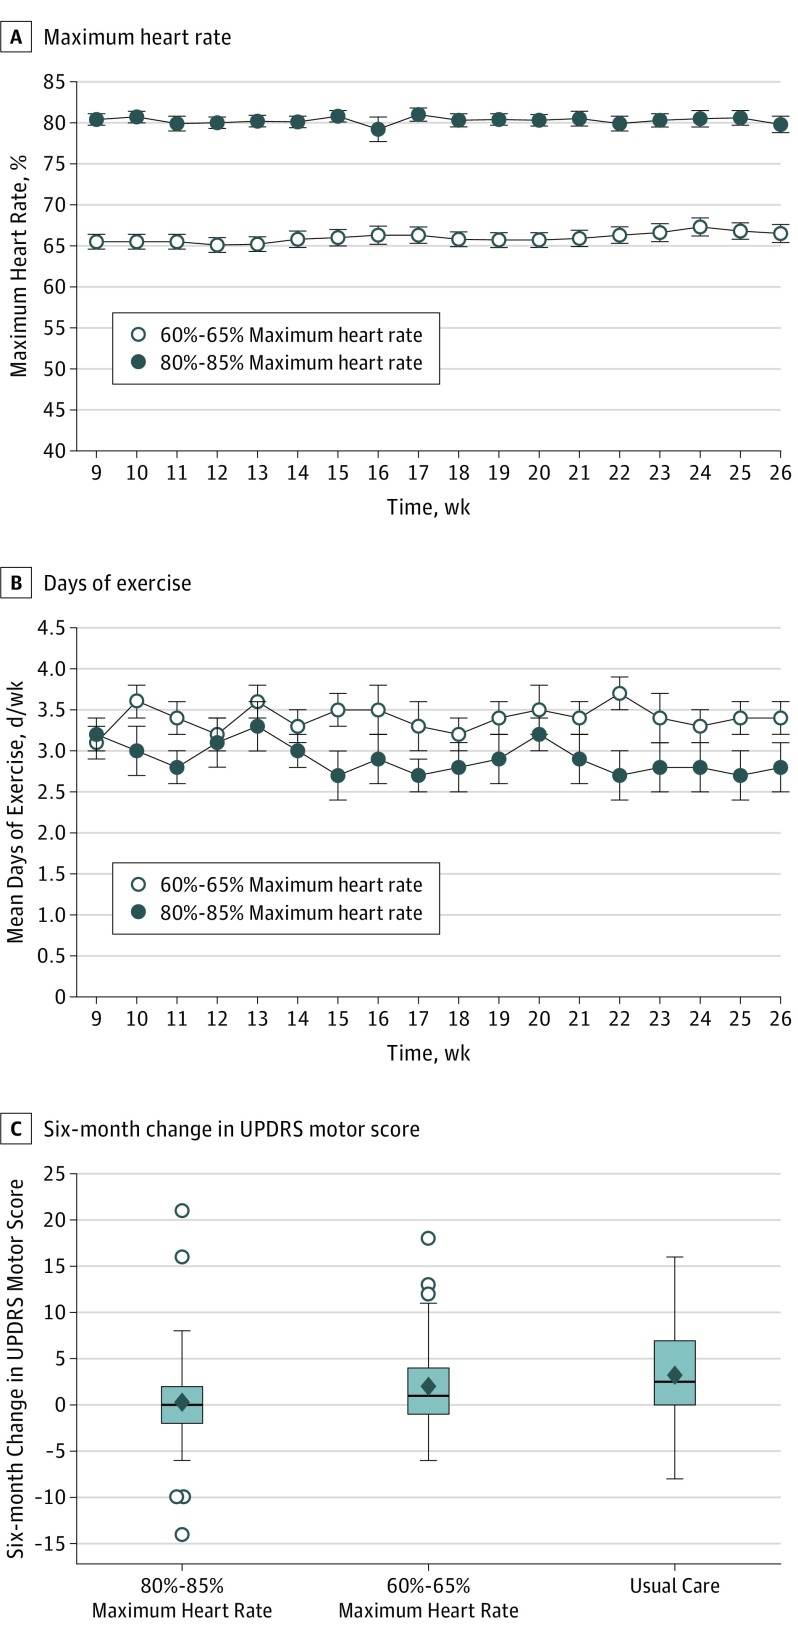
Figure 2. Study Outcomes.
A, Percentage maximum heart rate for each intervention group at 60% to 65% maximum heart rate and 80% to 85% across weeks 9 to 26. B, Mean days exercised for each intervention group across weeks 9 to 26. In A and B, symbols represent the means and bars are the SEs. Trends over time were tested using linear mixed models. C, Distribution of the 6-month Unified Parkinson’s Disease Rating Scale (UPDRS) motor change scores (6 months minus baseline), in which a positive change indicates worsening of motor symptoms. Each boxplot contains the median (horizontal line in the box), the upper quartile (75th percentile, top of box), the lower quartile (25th percentile, bottom of box), the mean (diamonds), whiskers, and outliers that are beyond 1.5 times the interquartile range (75th percentile minus the 25th percentile) from the 25th or 75th percentiles (circles). For usual care, the whiskers extend to the observed minimum and maximum. For the 80% to 85% maximum heart rate and the 60% to 65% maximum heart rate, the whiskers extend to the maximum and minimum values observed that were not outliers.

