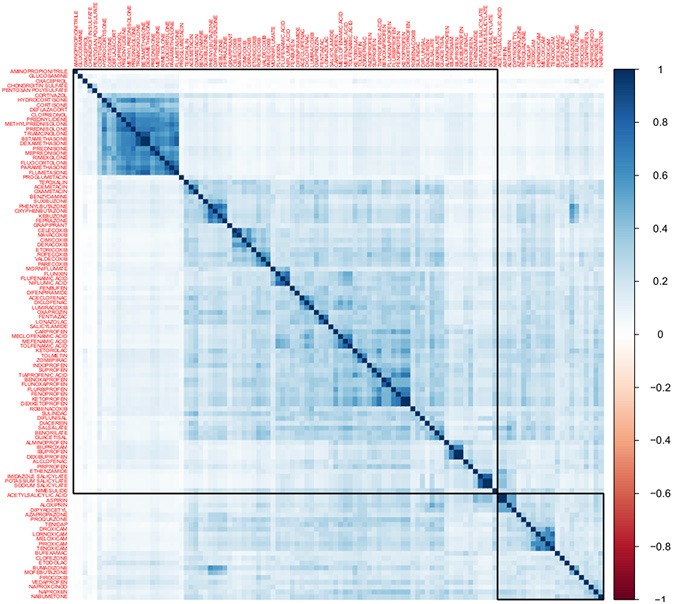
Figure 2.

Heatmap of Tanimoto structural similarity. This heatmap represents structural similarities between 110 anti-inflammatory drugs. The color intensity is proportional to the similarity between the chemical structure of two drugs measured using the Tanimoto coefficient. Drugs were ordered using non-supervised hierarchical clustering. Clusters in this matrix contain drugs with close chemical structures. For instance, a large cluster (purple outline) contains hydrocortisone and other drugs derived from it.
