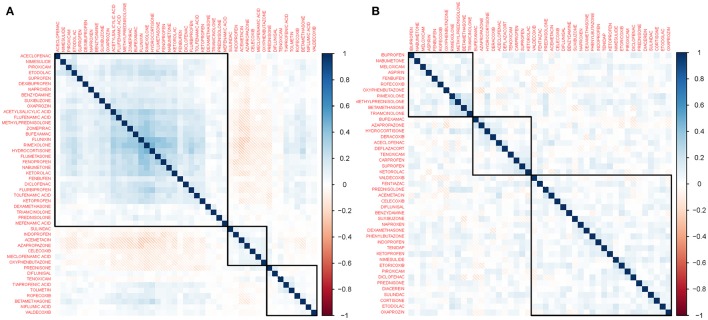
Figure 3.
Heatmap of gene perturbation similarity. These heatmaps represent similarities in gene expression profiles induced by drugs obtained from the (A) Connectivity Map (CMap) and (B) Library of Integrated Network-based Cellular Signatures (LINCS) datasets. The color intensity is proportional to the similarity between the gene expression profiles of two drugs measured using the Spearman correlation. Drugs are ordered using non-supervised hierarchical clustering. In both panels, a larger cluster containing most drugs and two smaller clusters are shown. The clusters comprise drugs that do not necessarily share structural similarities.

