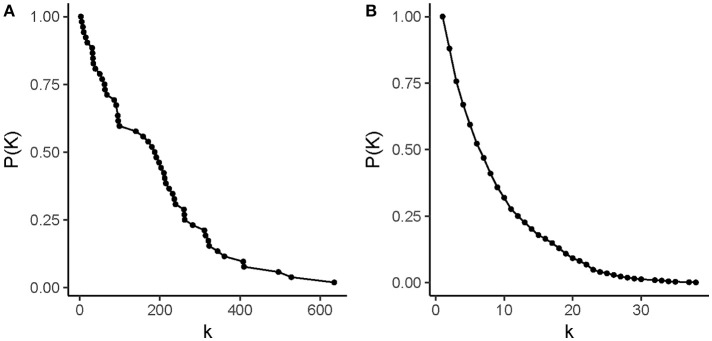
Figure 5.
Degree distributions in drug-adverse drug reaction (ADR) networks. This figure illustrates the degree distribution of (A) drug nodes and (B) ADR nodes. In each panel, the normalized, complementary cumulative degree frequency distribution is presented. Drug nodes have degree values that range from 0 to 635, while pathways have degree values that range from 1 to 38.

