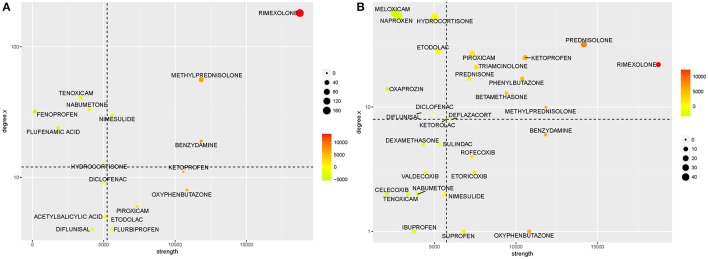
Figure 6.
Toxic and therapeutic potential of the anti-inflammatory drug space. In these figures, drugs are classified based on their risk of producing an adverse drug reaction (ADR, measured as the node strength from the drug-ADR network) and their potential alternative therapeutic uses [measured as the degree in a drug-pathway network, either derived from (A) the Connectivity Map (CMap) or (B) Library of Integrated Network-based Cellular Signatures (LINCS)]. Each axis is divided by its median value. Point color and size are proportional to position in the x and y axes. Following this classification, drugs in the upper, left quarter are the best repositioning candidates, as they have the most effects on alternative pathways and the least risk for ADRs.

