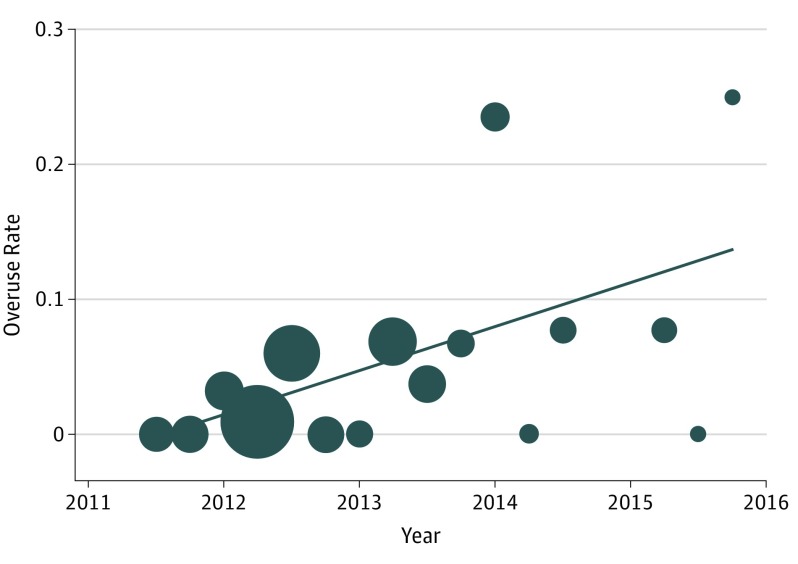
Figure 2. Changes in Rate of Overuse Over Time.
The rates are calculated as the number of overuses divided by the total number of patients cared for in our cohort within that period. Each data point is weighted by the number of patients cared for during that period; greater size indicates a higher number of patients. The line indicates results of linear regression. The slope of the regression is 0.033x − 65.6; R2 = 0.340.

